Head rice yield (HRY) is a widely accepted indicator of milling quality, defined as the mass percentage of rough rice kernels that are at least three-fourths of their original kernel length after milling (USDA, 1997).This quality feature is a key determinant of rice price and it strongly depends both on weather conditions occurring during the reproductive phase, and on grain moisture content at harvest.
The modelling approach developed by Lanning and colleagues (Lanning et al., 2011) simulates the HRYof rice as function of air temperature experienced by the crop during the R8 stage of the ripening period (Counce et al., 2009), when the main culm turns to brown. In particular this HRY index is calculated using a quadratic function of the 95-th percentile of nighttime air temperature values observed during the above-mentioned phenological phase.
The general equation developed for Japonica varieties is given below:
![]()
Where:
HRY (%) is the simulated HRY value;
Tn95th (°C) is the 95th percentiles of nighttime air temperature frequencies that occurred during the R8 phase of rice ripening;
ai, bi, ci (unitless) are the coefficients of the equation, specific for medium and long grain Japonica varieties.
In particular.
Basically, once a DVS equal to 2.5 is reached, the model for the simulation of HRY begins to receive as input the hourly values of air temperature. Thus, each day, the HRY model populate a list object by using the hourly temperature data included between Sunset and Sunrise hour. These latter are exogenous variables that vary depending on the latitude of the site where simulations are performed. At last, when physiological maturity stage (DVS = 3) is achieved, the values stored in the above mentioned list object are used to calculate the 95-th percentile of nighttime air temperature, which represents the input of the equation listed above.
Furthermore, the UNIMI.Cassandra.RiceQuality component implements an improved version of Lanning's approach which consider several limiting factors to the starch deposition process, such as the impact of high windiness and low humidity at sub-optimal thermal regimes.
In detail, the model was modified according to the following phases (Figure 1):
a) characterization of the original quadratic function by introducing thresholds for minimum (Tmin) and optimum temperatures (Toptmin and Toptmax) for the synthesis of starch in the rice grain;
b) change of the slope of the curve in the range of suboptimal thermal regimes (Temperature below Toptmin), in order to mimic the cultivar-specific susceptibility to breakage;
c) definition of specific rules to reproduce the dependency of HRY to low humidity and high windiness in conjunction with suboptimal temperatures for the starch synthesis. These unfavorable conditions could lead to the formation of weak areas in the grain that are more likely to break in the subsequent processing steps.
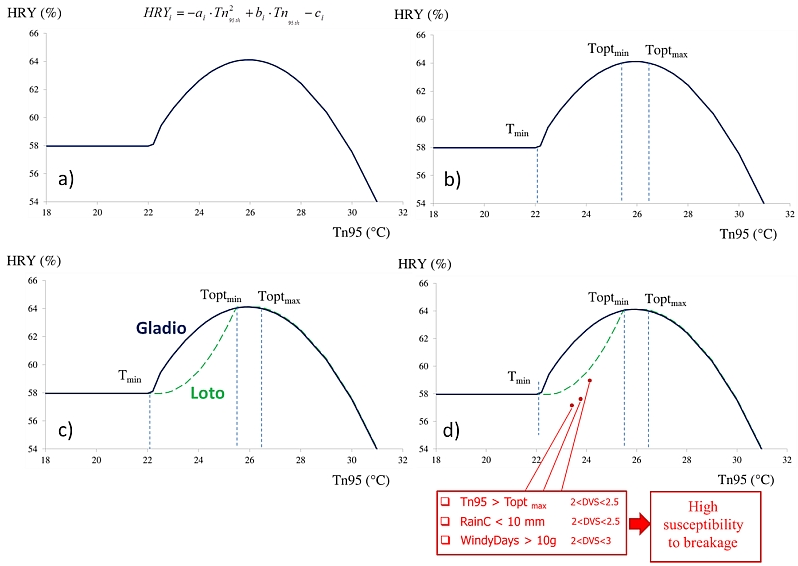
Figure 1. Changes in the HRY response function to temperature developed by Lanning a). The process involved the following phases: b) introduction of thresholds for minimum (Tmin) and optimum temperatures (Toptmin and Toptmax) for the synthesis of starch in the rice grain, d) definition of specific rules aimed at reproducing the impact on HRY of unfavorable weather conditions for the starch synthesis. Tn95 represents the 95-th percentile of nighttime air temperature within the range DVS 2.5 e DVS 3.
Indeed the new developed version of the model was then formalized using the two equations below:

Where:
HRYi (%) is the simulated HRY value;
Tn95th (°C) is the 95th percentiles of nighttime air temperature frequencies that occurred during the R8 phase of rice ripening;
Toptmin (°C) and Toptmax (°C ) respectively represent the minimum and optimum temperatures for the synthesis of starch in the rice grain;
Tmin (°C) represents the minimum temperature threshold for the starch synthesis.
ai, (0.6073 for Loto variety, -0.1791 for Gladio variety; unitless) bi, (-27.848 for Loto variety, 8.5375 for Gladio variety; unitless) ci (379.5568 for Loto variety, - 36.1533 for Gladio variety; unitless) are variety-specific coefficients of the equation;
di, (-0.39685 for Loto variety, -0.1791 for Gladio variety; unitless), ei, (20.585 for Loto variety, 8.5374 for Gladio variety; unitless), gi (-202.89 for Loto variety, -0.1791 for Gladio variety; unitless) are variety-specific
In particular the actual HRY (HRYc) is computed by subtracting from the potential value of HRY the variety-specific reduction in HRY experimentally determined for the study area (parameter e, %) when rainfall (RainC), wind (WindTh) and temperature (T95em) regimes simultaneously exceed specific critical thresholds within the sensitive period after flowering:

Where:
HRYc (%) is the actual value of HRY;
e (%) (%) is a variety-specific coefficient representing the HRY reduction due to critical humidity, wind and temperature conditions with respect to the average values of HRY for the simulated variety;
Tn95thp (°C) is the 95th percentiles of nighttime air temperature frequencies that occurred during the early maturity (2<DVS<2.5);
RainC (mm) is the minimum threshold of cumulated rainfall triggering HRY decrease;
WindyDays (day) is the number of days with average wind speed higher than a critical threshold,(WindyTh, m s-1) to start HRY decrease.
The new approach has been developed and parameterized for Loto (Japonica) and Gladio (Indica) Italian rice varieties, using field data collected by the National Rice Authority (ENR; www.enterisi.it) in the Lombardo-Piemontese district (Major European rice district - northern Italy) during the seasons 2006–2013.
Created with the Personal Edition of HelpNDoc: Full-featured EPub generator