Indices are qualified indicators, because compared to standard values.
Indicator |
Metric |
P intensity |
Simple Daily Intensity (SDI) [Stone et al., 1999] |
P seasonality |
Rainfall Seasonality Index (SIP) [Walsh and Lawler, 1981] |
P heterogeneity |
Modified Fournier Index (FIm) [FAO/UNEP, 1977] |
T continentality |
Emberger-derived Continentality Index (M-m) [Emberger, 1930], Gorczinski Continentality Index (K) [Gorczinski, 1920] |
P continentality |
Mediterraneity Index (MI2) [Le Houérou, 2004] |
P+T aridity |
De Martonne-Gottmann Index (b) [De Martonne, 1942] |
R+P aridity |
Budyko Aridity Index (Q) [Budyko, 1974] |
P+ET aridity |
Desertification Index (ID) [UNEP, 1992] |
P+T moisture |
Moisture Index (IM) [Carter and Mather, 1966] |
P (mm): precipitation
Pt (mm): minimum threshold precipitation (e.g. 0.2 mm)
∑P (mm): sum of P > Pt

SDI < 2 mm d-1: light
2 mm d-1 ≤ SDI < 5 mm d-1: intermediate
5 mm d-1 ≤ SDI: heavy
T (oC): air temperature
R (MJ m-2 d-1): solar radiation

SIP < -0.13: wetter winters than summers
-0.13 ≤ SIP ≤ 0.13: uniform distribution
SIP > 0.13: wetter summers than winters
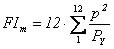
FIm < 1300: uniformity
1300 ≤ FIm < 1800: fairly poor uniformity
1800 ≤ FIm < 2200: poor uniformity
2200 ≤ FIm < 2500: irregularity
2500 ≤ FIm < 2700: fairly high irregularity
FIm > 2700: high irregularity
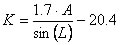
K ≤ 12.4: maritime
12.4 < K ≤ 18.4: weakly maritime
18.4 ≤ K < 27.4: neutral
27.4 ≤ K<33.4: weakly continental
33.4 ≤ K: continental

MI2 < 1.5: non seasonal, non-Mediterranean climate (tropical or temperate)
1.5 ≤ MI2 < 2: sub-Mediterranean climate
MI2 > 2: typical Mediterranean climate
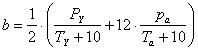
b < 5: extreme aridity
5 ≤ b ≤ 14: aridity
15 ≤ b ≤ 19: semi-aridity
20 ≤ b ≤ 29: sub-humidity
30 ≤ b ≤ 59: humidity
b > 59: strong humidity

Q ≤ 1: no water deficit
1 < Q ≤ 3.4: limited water deficit
3.4 < Q ≤ 10: severe water deficit
Q > 10: desert climate
![]()
ID < 0.05: very arid
0.05 ≤ ID < 0.20: arid
0.20 ≤ ID < 0.50: semi-arid
0.50 ≤ ID: dry sub-tropic
PY (mm): annual precipitation
PS (mm): summer semester (May-October in the northern hemisphere, November-April in the southern hemisphere) precipitation
PW (mm): winter semester (November-April in the northern hemisphere, May-October in the southern hemisphere) precipitation
p (mm): monthly precipitation
M (oC): mean daily maximum temperature of the warmest month
m (oC): mean daily minimum temperature of the coldest month
M - m < 15 °C: oceanic insular zones
15 ≤ M - m < 25 °C: lowland littoral zones
25 ≤ M - m < 35 °C: semi-continental zones
35 °C ≤ M - m: continental zones
A (oC): mean annual air temperature amplitude
L (o): latitude (absolute value) of the site
Ps (mm): summer trimester (June-August in the northern hemisphere, December-February in the southern hemisphere) precipitation
Pw (mm): winter trimester (December-February in the northern hemisphere, June-August in the southern hemisphere) precipitation
pa (mm): precipitation of the most arid month
TY (oC): mean annual air temperature
Ta (oC): mean air temperature of the most arid month
Rn (MJ m-2 year-1): annual sum of net solar radiation (=0.45·Rg)
Rg (MJ m-2 year-1): annual sum of incoming solar radiation
l (MJ kg-1): latent heat of vaporization (=2.45)
ETY (mm): annual total reference evapotranspiration
WS (mm): annual surplus of water (sum of positive differences between precipitation and reference evapotranspiration)
WD (mm): annual deficit of water (sum of negative differences between precipitation and reference evapotranspiration
Created with the Personal Edition of HelpNDoc: Free EPub producer