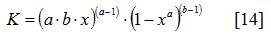
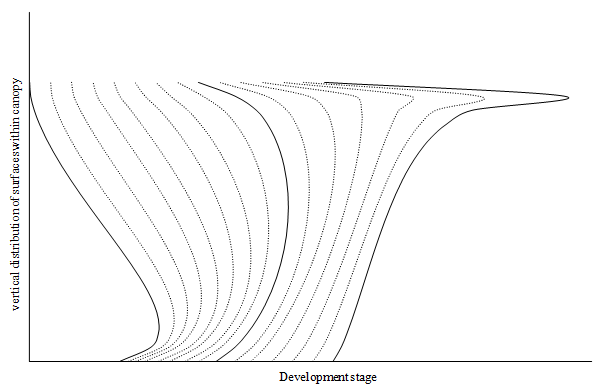
Rapeseed displays a high variability in the distribution of photosynthetic areas within the canopy during the crop cycle. From emergence till the differentiation of flower buds, most of the photosynthetic surfaces are located at the bottom of the canopy, whereas during flowering they are homogeneously distributed along the vertical profile of canopy. After the formation of pod, apical regions and siliquae make up most of photosynthetic areas. To model these morphological modifications during phenological development, a derived β (Jones, 2009) distribution was adopted. This function (Equation 14) is a continuous distribution of probability driven by two parameters (a, b) and defined in [0,1] interval.
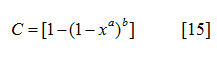
During the simulation, the canopy is split into 20 horizontal layers. Green PAI is distributed each day among these layers by the β distribution integrated on 20 points (0.05, 0.1, 0.15,…1). The amount of photosynthetic areas in each layer is calculated with the cumulative distribution function (Equation 15, where x represents the integration points) as the difference between the results of equation 15 applied to two consecutive points.
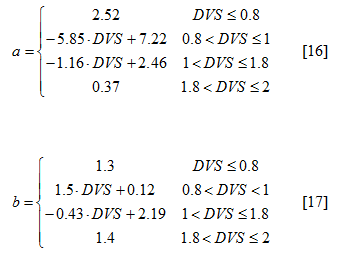
The measurements of CPAI at different height within the canopy vertical profile allowed to set the values of the two parameters (i.e., a and b) driving the β distribution as a function of DVS (Equations 16 and 17). These equations were defined in order to fit simulated PAI values at different heights within the canopy with data observed along the crop cycle. The resulting dynamic of the distribution function is shown in the figure below To make model outputs comparable with measured data, the simulated canopy layers were grouped coherently with the number of different heights sampled in each date.
Created with the Personal Edition of HelpNDoc: Easily create CHM Help documents